Last week I started my 4-part blog series by discussing Message Logging in TM1. This week, I will review monitoring server performance using control cubes.
Monitoring Server Performance using Control Cubes
TM1 is built in performance monitoring tools exist as system cubes called Control Cubes. These four cubes hold performance statistics for clients, cubes and servers. Once these cubes are selected to capture statistical information- they track changes on a minute-by-minute basis.
}StatsByClient:
This cube tracks message count, average message size, total elapsed time and other measures:
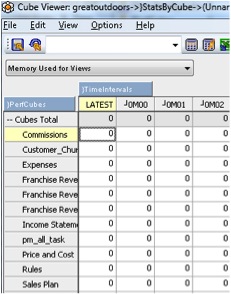
}StatsByCube:
This cube tracks the memory used for each cube on the server:
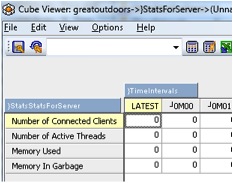
}StatsForServer:
This cube tracks the connected clients, active threads and memory used for the server.
TM1 allocates memory as it needs it from the operating system (OS). However, when it frees memory, it does not return it to the OS but puts it in a garbage list, which it then re-uses as needed. Accordingly, the operating system performance monitor will not give you an accurate measure of the current consumption of memory of the TM1 Server. From below, the sum of the “memory used” and “memory in garbage” corresponds to the memory consumption reported by the OS performance monitor.
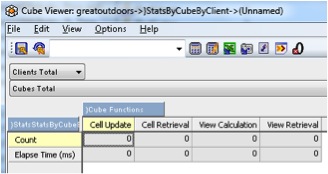
}StatsByCubeByClient:
This cube tracks the number of cell updates, cell retrievals, view calculations and view retrievals for each client and cube on the server.
Check back in next week for part 3 of Performance Monitoring with TM1, where I will be briefly go over TM1 Top Utility.