In my last blog post, I discussed how to correctly use determinants and stitch queries in Cognos. Today, I wanted to offer technical tips pertaining to master-detail relationships in Cognos.
Sales reports, employee performance, regional stats are all reports that use, in some form or another, master-detail relationships. At the most basic level, this functionality allows us to split data into multiple sections or to embed other objects in lists.
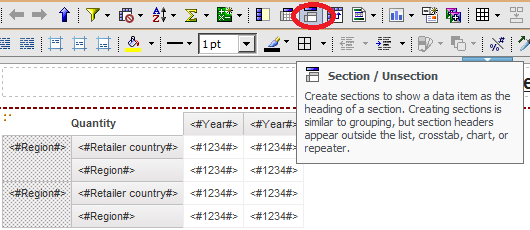
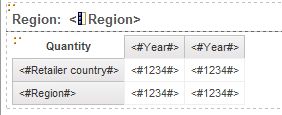
A few practical examples might be sectioning a crosstab:
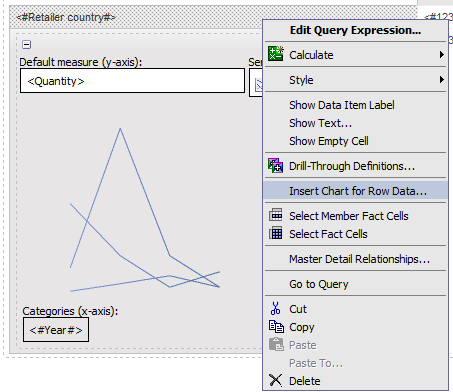
Or embedding a micro chart in the rows:
And running, we get the following report:
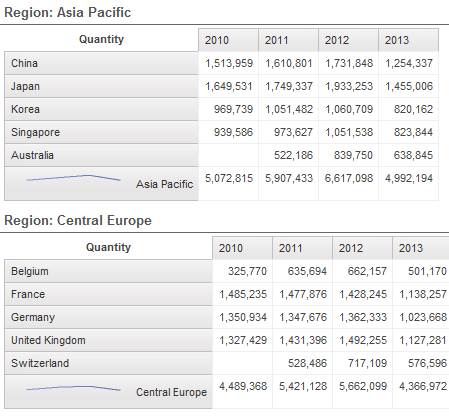
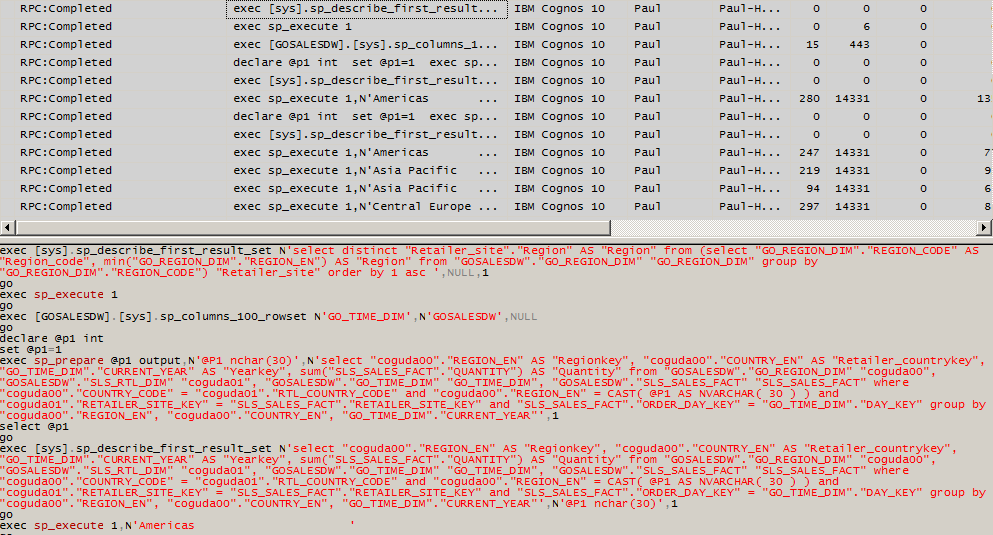
If we were to trace the run, we would see several separate select statements. First, it would run a query to get a list of all regions. Second, it would run separate queries to get each crosstab and graph.
If we look at the trace, we see exactly that:
The sample model that I’m using is based on the CQM engine. If we were using DQM, and if the master-detail optimization governor was enabled, Cognos might be able to drop the number of queries down to 3. One for the list of regions, one for the crosstab, and one for the graph. The queries would be cached and Cognos would intelligently split the data there.
That’s the normal usage of master-details, let’s talk about more interesting things. In addition to sectioning data, we can pass values to parameters. This allows us to solve complex requirements.
Dynamic Filters
By populating a table with filter expressions, we can generate different pages with the same crosstab but different filters. This happens more with operational systems than data warehouses, but there are some cases where it is useful.
In this example, we are looking at specific managers working against specific promotion campaigns.
Name Filter
An Li [Sales (query)].[Promotions].[Campaign name] in (‘Hibernator Campaign’, ‘Course Pro Campaign’)
Aron AdelsvΣrd [Sales (query)].[Promotions].[Campaign name] in (‘Course Pro Campaign’, ‘Seeker Campaign’)
Dietz Krieger [Sales (query)].[Promotions].[Campaign name] in (‘TrailChef Campaign’, ‘Rising Star Campaign’)
Isabel Torres [Sales (query)].[Promotions].[Campaign name] = ‘Canyon Mule Campaign’
Maria Boscolo [Sales (query)].[Promotions].[Campaign name] in (‘Big Rock Campaign’, ‘Outdoor Protection Campaign’)
The manager can be sectioned as usual, while the filter can be passed directly to a parameter. With the prompt macro #prompt(‘Filter’,’token’,’1=1′)# as a detail:
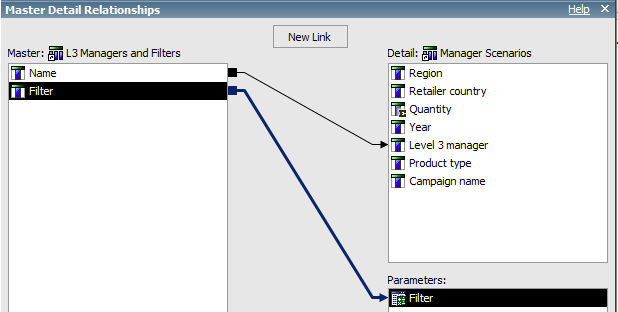
Each details would have different filters applied. This does not need to be limited to specific campaigns. We could just as easily filter by a campaign for a year for An Li, and for a region and product line for Dietz Krieger.
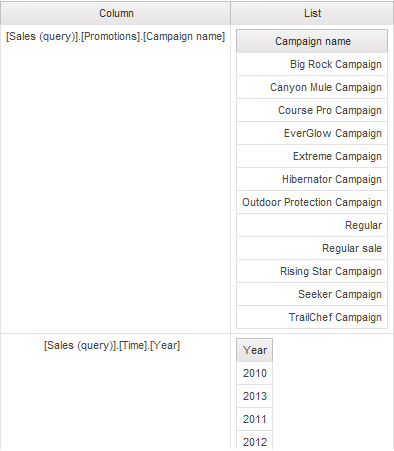
This is not limited to filters, columns can be applied as well. By using the token prompt inside a field, and populating that with a field reference, it is possible to dynamically modify a list.
As a practical example, consider a scenario presented by one of my past clients. A series of reports needed to be bursted to a number of managers. Each manager had a unique set of filters to be applied. Some of them needed to see data at a high level of granularity, and others needed to see detailed data. The same set of filters needed to be applied to multiple reports. The standard method, by joining the burst table to the necessary fact tables, would not work here due to the vast range of requirements.
One way to solve this would be to have each manager create a report view for each report he needed. He would then be responsible for ensuring the filters he used were correct. Unfortunately, that simply was not feasible – not all of the managers were comfortable using Cognos. There were also too many reports and managers for the different managers to keep track of which managers created report views for which reports.
Instead, a table was created containing the manager name, email report name, and the necessary filters and columns. The reports themselves all referenced the burst table, filtered by report name. If a manager did not have that report name listed, he would not get the report. The queries inside the report had a number of filters similar to the token prompt above. Finally, the table itself was rebuilt through ETL on a nightly basis, therefore ensuring that all managers would automatically receive the correct reports with the correct filters.
Questions, comments regarding this? Fill out the comment box below, or email us at info@performanceg2.com.