When building a chart in Report Studio, some smaller contributing items can now be easily grouped together based on rules that you define. Of course, this could have been accomplished in Cognos 8, but you would have to define your own logic statements.
For the following example, I will be building a chart using the Cognos 8 sample data. *NOTE: When opening up Cognos 10 Report Studio using models that were built in Cognos 8, you will have to go to “Tools > Options > Advanced Options”, and un-check “use legacy chart authoring”.
1. Start by choosing the default column chart.
2. Add revenue as the measure.
3. Add product type as the categories.
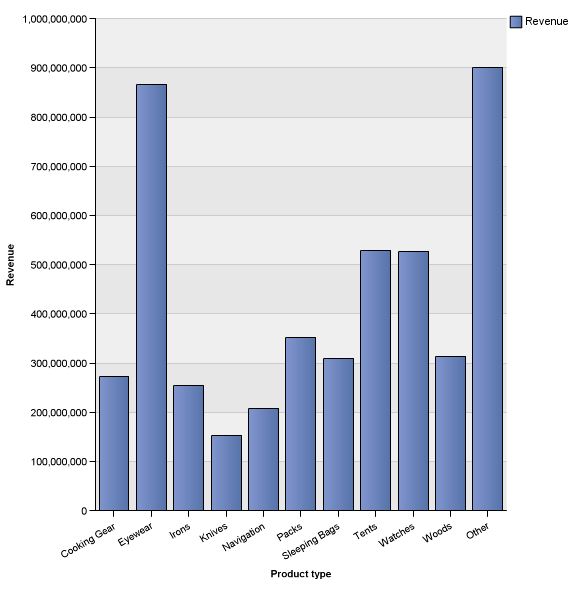
4. Running the report results in the following chart:
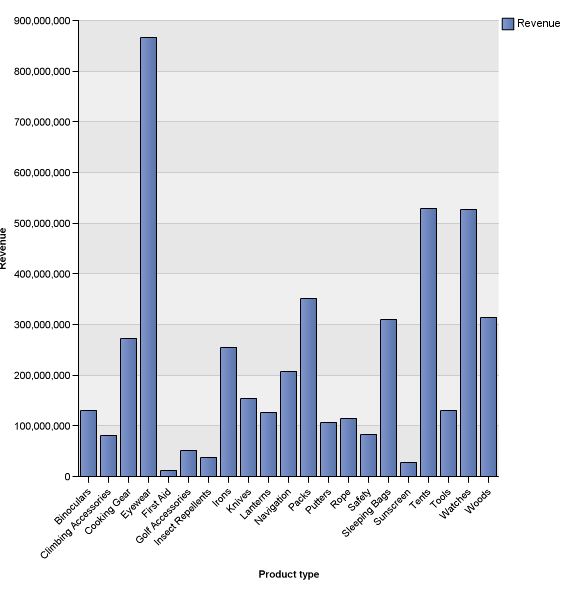
5. You will notice that some product types hardly contributed to the overall revenue when compared to some of the better selling product types. There are a few choices on how to handle these. With the chart selected, under the general section of the properties pane, there is a new property called “Summarize Small Items”.
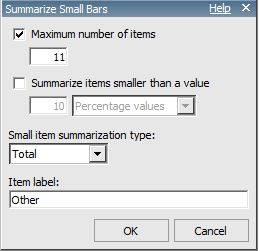
For this example, I put the maximum items to be displayed at 11. This will give me the top 10, plus another column that will be the total summarization. You could also choose to summarize smaller items based on a percentage threshold, or by absolute values.
6. After the property changes, this is the new output: