One of the sessions that I attended at the IBM Information On Demand 2013 conference a couple weeks ago was Advanced Reporting Techniques, a presentation focusing on various features of Cognos Report Studio that are neglected.
One of those features was the utilizing the generated background image. A few examples were shown during the session of using generated backgrounds to make impressive graph backgrounds or buttons. Unfortunately, it does have some limitations, including the image must be a static height and width. In one of the examples showed, it is possible to nest an image in a container smaller than the image. This allows for an interesting effect:
![]()
By cutting off the end of one, it’s possible to make an impressive looking button. Reversing it is simple – it’s a matter of setting the direction property to ‘right to left’:
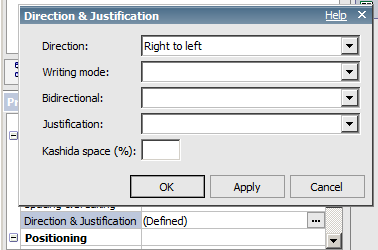
And that gets you:
![]()
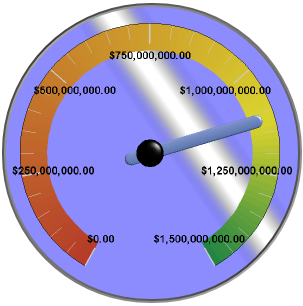
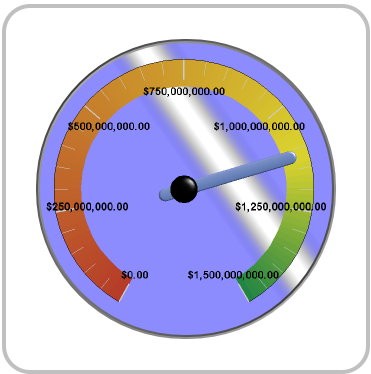
While I tend to avoid gauges, it’s possible to pretty them up using generated images. In this example, I set the background effect on the gauge chart, and disabled the legend. The effect is quite impressive:
While impressive as all of this is, there is a difficult limitation – the object that has the background effect must have a static size, and height and width must be assigned using an absolute value, not a percentage. But what happens if we want to apply this to an object that might grow or shrink? Let’s say that we want a list with rounded edges (don’t worry, the Apple patent doesn’t apply here).
Normally we would do this with a series of images saved on the gateway. Upper left corner, upper right corner, bottom left corner, bottom right corner, and we would have a million and four of those for every possible variation in style that might be needed. That’s a lot of effort for such a simple effect. Instead, let’s try with the background effect.
We will start with the frame – a list containing three rows and three columns. The corners will have the generated effects inside a block, the middle edges will be a standard border, and the content will be placed into the center square.
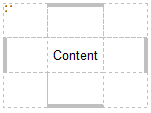
The table cells are set to 30px wide and 35px high, with the edges containing borders of 3pt. The upper corners are a simple modification of the button created by the speaker of the session. The outer blocks are set to 45 wide, 35 high, and ‘contest is clipped’. Inner block is 60 wide and 70 high. The right one has the direction right to left. So the top row is easy, but how do we set the bottom row? The first thing that came to my mind was to set the margin to a negative number. But for some reason, the input will only let me type in numbers, not a dash.
This is where another session that I attended at the conference comes in handy. Hertz had a presentation on creating an XML snippet library for use in Cognos Workspace. Users would copy XML from this library, and modify the XML marked in red to make more advanced dashboards. The same basic idea can apply here. I will set the top margin to 35px, cut and paste it into notepad++ (xml is reformatted for ease in reading):
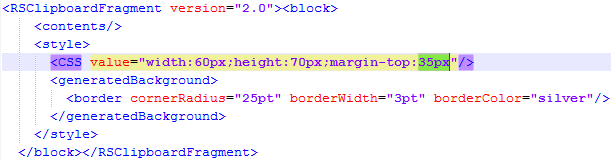
Notice where it says ‘margin-top:35px’? Let’s add a minus right before the 35…and voila! We have negative margins. I’ll apply to the lower right and run the report:
Now let’s try it with some actual content, like the chart from before:
At this point the table will expand and contract without breaking the curvy corners.
There are other uses for the generated backgrounds, and I would be very interested to hear how other developers are using them – feel free to leave me a comment and let me know.